How does snagging and defect data tell you which supplier to drop?
Uudised
•

Sisukord
Ole esimene kes kuuleb uutest projektidest ja uudistest
A short TL;DR first -

Most developers treat warranty claims as a queue: problems in, repairs out, queue empty, job done. That view leaves money on the table.
Handled properly, your warranty claims are also a dataset - and it is the most honest dataset you will ever get about your own construction quality, because your customers compile it for free.
What can defect data actually tell a developer?

Individually, a warranty claim is a repair. In aggregate, claims answer questions that matter for your next project:
1. Which components fail repeatedly?
If the same tap drips in unit after unit, that is not a run of bad luck - it is a product or supplier decision showing its true cost. Noticing it means you can change supplier before the next project, not after.
2. Which subcontractors' work generates claims?
Defects clustered around one trade or one contractor's scope tell you exactly where your quality problem lives.
3. Which design choices create a maintenance burden?
Some defects are not build errors but design consequences. Aggregated data separates the two.
4. What does after-sales actually cost per project?
Without claim-level records, warranty cost is a lump. With them, it is attributable - to products, trades and design decisions.
Every one of these insights compounds: it improves the next project, which reduces the next warranty period's claims, which protects the customer relationships that produce repeat buyers.
Why do most developers never see these patterns?

Because the data is scattered by design. The typical warranty operation runs on one spreadsheet per project manager, and one shared claims inbox - a structure that makes aggregation practically impossible.
Estonian developer Kaamos Ehitus described this exact starting point: every site manager kept their own Excel file, so there was no proper company-wide overview and no reliable summary of typical defects. Solving past issues was difficult because relevant data was buried in the inboxes of former employees, and many Excel files had to be manually reconciled. Read the Kaamos Ehitus case study.
You cannot analyse what you cannot assemble. The pattern of dripping taps across forty units is invisible when those forty claims live in four different spreadsheets.
How do you turn claims into usable data?

Three requirements, none of them complicated:
1. One log for all claims, across all projects. Aggregation is impossible without a shared structure. Every claim needs the same fields: project, unit, homeowner, defect category, description, contractor, deadline, status, resolution date.
2. Categorise every defect, consistently. Categories are what make the data queryable - plumbing, electrical, windows and doors, finishes, appliances, exterior. In Hausing, you can categorise all problems by client, building and your own defined categories, then filter and analyse them because everything sits in one place.
3. Review the aggregate on a schedule. Data nobody looks at is storage, not intelligence. A quarterly review of claims by category and by project - alongside statuses and deadlines - is enough to surface every pattern worth acting on.
Capture matters too: the earlier a defect enters the system, the more complete your dataset. Fellow Estonian developer Liven runs its apartment inspections fully digitally in Hausing, so every snag found at handover becomes a task with photos, an assignee and a category from day one - no paper forms, no retyping. Read the Liven case study.
See how Hausing turns warranty management and snagging into usable data.
What does this look like at review time?

A defect review with real data changes the conversations you can have. Procurement discussions become evidence-based: this supplier's product generated this many claims across these projects. Subcontractor negotiations gain a quality dimension with numbers attached. Design reviews for the next project inherit a list of what caused after-sales pain in the last one.
This is exactly how Kaamos uses Hausing's analytics: compiling summaries of common issues at the end of each project and improving work processes accordingly. Their head of warranty and quality, Alex Talisainen, is blunt about the alternative: "I don't see any reason why a real estate developer today should still be using Excel."
And there is a customer-facing dividend: developers who analyse their defect data fix systemic causes, which means their next project's buyers experience fewer defects - which, as we have argued elsewhere, is marketing in its purest form.
Where should you start?
Start with structure this week. Your defect patterns are probably already visible - they're just split across spreadsheets.
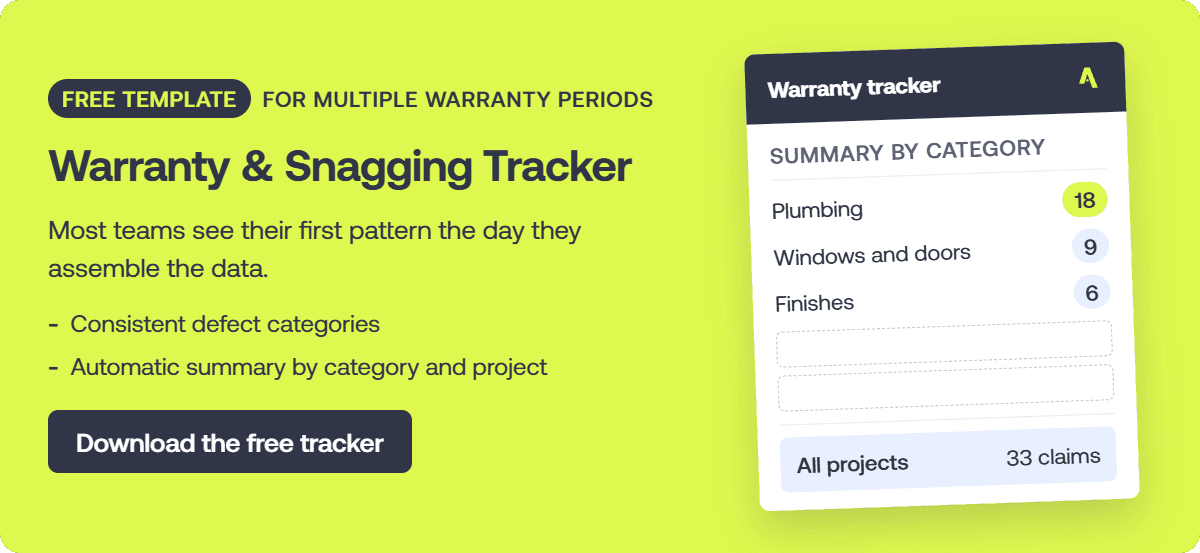
Running more than a couple of active warranty periods? Download the free Warranty & Snagging Tracker: consistent defect categories and an automatic summary by category and project. Most teams see their first pattern the day they assemble the data.
Want to see the same breakdown running live across projects? Book a call, and we'll show you defect analytics in Hausing.
Selles artiklis leiad:
Treated as a queue, warranty claims are just repairs. Treated as a dataset, they reveal which components fail repeatedly, which subcontractors generate claims, which design choices create maintenance burden, and what after-sales actually costs per project. To get there you need one log for all claims, consistent defect categories, and a scheduled review of the aggregate.
Your download is ready
Thanks — here’s the full document. It’s yours to keep and share internally.
Related insights


Oled valmis?
Too kõik töövood ühele platvormile
How does snagging and defect data tell you which supplier to drop?
Uudised
•
Sisukord
Ole esimene kes kuuleb uutest projektidest ja uudistest
A short TL;DR first -
Most developers treat warranty claims as a queue: problems in, repairs out, queue empty, job done. That view leaves money on the table.
Handled properly, your warranty claims are also a dataset - and it is the most honest dataset you will ever get about your own construction quality, because your customers compile it for free.
What can defect data actually tell a developer?
Individually, a warranty claim is a repair. In aggregate, claims answer questions that matter for your next project:
1. Which components fail repeatedly?
If the same tap drips in unit after unit, that is not a run of bad luck - it is a product or supplier decision showing its true cost. Noticing it means you can change supplier before the next project, not after.
2. Which subcontractors' work generates claims?
Defects clustered around one trade or one contractor's scope tell you exactly where your quality problem lives.
3. Which design choices create a maintenance burden?
Some defects are not build errors but design consequences. Aggregated data separates the two.
4. What does after-sales actually cost per project?
Without claim-level records, warranty cost is a lump. With them, it is attributable - to products, trades and design decisions.
Every one of these insights compounds: it improves the next project, which reduces the next warranty period's claims, which protects the customer relationships that produce repeat buyers.
Why do most developers never see these patterns?
Because the data is scattered by design. The typical warranty operation runs on one spreadsheet per project manager, and one shared claims inbox - a structure that makes aggregation practically impossible.
Estonian developer Kaamos Ehitus described this exact starting point: every site manager kept their own Excel file, so there was no proper company-wide overview and no reliable summary of typical defects. Solving past issues was difficult because relevant data was buried in the inboxes of former employees, and many Excel files had to be manually reconciled. Read the Kaamos Ehitus case study.
You cannot analyse what you cannot assemble. The pattern of dripping taps across forty units is invisible when those forty claims live in four different spreadsheets.
How do you turn claims into usable data?
Three requirements, none of them complicated:
1. One log for all claims, across all projects. Aggregation is impossible without a shared structure. Every claim needs the same fields: project, unit, homeowner, defect category, description, contractor, deadline, status, resolution date.
2. Categorise every defect, consistently. Categories are what make the data queryable - plumbing, electrical, windows and doors, finishes, appliances, exterior. In Hausing, you can categorise all problems by client, building and your own defined categories, then filter and analyse them because everything sits in one place.
3. Review the aggregate on a schedule. Data nobody looks at is storage, not intelligence. A quarterly review of claims by category and by project - alongside statuses and deadlines - is enough to surface every pattern worth acting on.
Capture matters too: the earlier a defect enters the system, the more complete your dataset. Fellow Estonian developer Liven runs its apartment inspections fully digitally in Hausing, so every snag found at handover becomes a task with photos, an assignee and a category from day one - no paper forms, no retyping. Read the Liven case study.
See how Hausing turns warranty management and snagging into usable data.
What does this look like at review time?
A defect review with real data changes the conversations you can have. Procurement discussions become evidence-based: this supplier's product generated this many claims across these projects. Subcontractor negotiations gain a quality dimension with numbers attached. Design reviews for the next project inherit a list of what caused after-sales pain in the last one.
This is exactly how Kaamos uses Hausing's analytics: compiling summaries of common issues at the end of each project and improving work processes accordingly. Their head of warranty and quality, Alex Talisainen, is blunt about the alternative: "I don't see any reason why a real estate developer today should still be using Excel."
And there is a customer-facing dividend: developers who analyse their defect data fix systemic causes, which means their next project's buyers experience fewer defects - which, as we have argued elsewhere, is marketing in its purest form.
Where should you start?
Start with structure this week. Your defect patterns are probably already visible - they're just split across spreadsheets.
Running more than a couple of active warranty periods? Download the free Warranty & Snagging Tracker: consistent defect categories and an automatic summary by category and project. Most teams see their first pattern the day they assemble the data.
Want to see the same breakdown running live across projects? Book a call, and we'll show you defect analytics in Hausing.
Selles artiklis leiad:
Treated as a queue, warranty claims are just repairs. Treated as a dataset, they reveal which components fail repeatedly, which subcontractors generate claims, which design choices create maintenance burden, and what after-sales actually costs per project. To get there you need one log for all claims, consistent defect categories, and a scheduled review of the aggregate.
Your download is ready
Thanks — here’s the full document. It’s yours to keep and share internally.
Related insights
Too kõik töövood ühele platvormile